The score moved from 5 to 7. Here is what just changed.
Last month I said watch two things: whether the 10-year held above 4.60%, and whether the August jobs report confirmed June's slowdown.
The 10-year hit 4.74% this month. And July payrolls just came in at −23,000.
That is not a warning sign. That is a confirmed trend.
THE AUGUST 2026 SCORECARD
Total Score: 7 of 10 | Zone: Elevated Caution Score moved from 5 to 7. Two signals deteriorated. Zero improved.
SIGNAL 1 — REIT Relative Strength (VNQ vs SPY) GREEN / 0 pts — Holding, but spread compressed sharply
VNQ YTD: +14.18% | SPY YTD: +12.55% | Spread: +1.63pp
Last month the spread was +5.22pp. It compressed to +1.63pp in a single month. VNQ is still outperforming — the signal stays green — but the conviction that drove that lead is fading fast. When the 10-year spikes toward 4.75%, REIT equities feel it first.
Watch: a fade below +1pp flips this yellow immediately. The sequencing logic still holds, but the margin is thin.
SIGNAL 2 — BBB Corporate Credit Spreads GREEN / 0 pts — Holding, creeping wider
BBB OAS as of Aug 20, 2026: 100 bps July reading: 96 bps | Cycle low: 92 bps (May)
The credit window is still open. But we have now moved 8 bps off the cycle low in two months while the 10-year has risen 30+ bps over the same period. The bond market is not cracking on credit quality — yet. That divergence cannot hold indefinitely if rates stay elevated.
Watch: 120 bps flips this yellow. We are still 20 bps away. But the direction is no longer favorable.
SIGNAL 3 — 10-Year Treasury Direction RED / 2 pts — Accelerating above the danger line
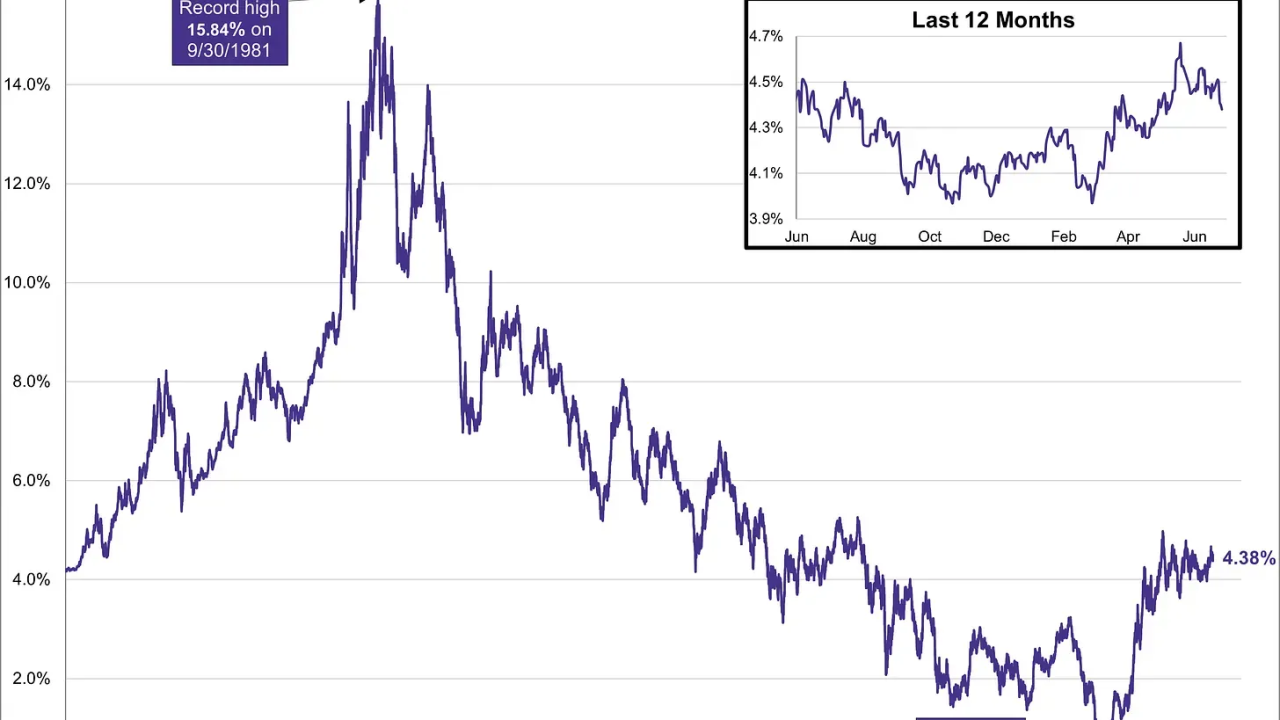
10-Year as of Aug 25, 2026: 4.65% August intra-month peak: 4.74% July reading: 4.63%
I flagged 4.60% as the ceiling on deal math in July. We have now spent the entire month above it — and touched 4.74% last week. That is not drift. That is pressure.
At current levels, standard acquisition underwriting does not pencil without seller concessions, compressed going-in returns, or a very specific operational value-add thesis. Bridge debt is expensive. Refinancing assumptions are fiction.
This does not move until we get a sustained close below 4.30%. That is not happening this month.
SIGNAL 4 — Unemployment & Payrolls RED / 3 pts — FLIPPED. This is the biggest move on the board.

A preferred take on the financials sector
Saira Malik 4 years ago
Prints, Vaults & the 400-Year Lie
Arie van Gemeren, CFA 2 months ago

V-shaped recovery 🌼📉📈
Dan Mikulskis 1 year ago
July 2026 payrolls: −23,000 Unemployment: 4.1% | Prior months revised down: −103,000 combined
This signal was yellow last month. It is red now.
−23,000 payrolls is the first outright decline in nonfarm employment in this cycle. May was revised from +129,000 to +63,000. June was revised from +57,000 to +20,000. The revisions are telling you that what looked like a slowing labor market was actually a deteriorating one.
Financial activities shed 14,000 jobs — the sector most directly connected to CRE capital flows. Temporary layoffs jumped 153,000. Labor force participation has declined 0.7 percentage points since January.
The headline unemployment rate dropped to 4.1%. That number is doing a lot of work to obscure what the internals are showing. Watch the September 4 report. Two consecutive negative prints change the Fed's posture — and potentially the rate trajectory — faster than any FOMC statement.
SIGNAL 5 — Bank Lending Standards (July 2026 SLOOS) YELLOW / 2 pts — Modest improvement, bifurcation persists
July 2026 SLOOS: Large banks eased across all CRE categories — NFNR, multifamily, and CLD. Community and regional banks: unchanged on multifamily and CLD. Fourth consecutive survey with this same split.
This is the first month where the overall direction moved even marginally toward easing. But "large bank easing" does not fund a Kansas City value-add deal. The community and regional banks that capitalize secondary and tertiary market transactions are still sitting on their hands for construction and land development paper. The bifurcation is structural at this point, not cyclical.
WHAT CHANGED. WHAT DIDN'T. WHAT IT MEANS.
The score moved from 5 to 7 because the real economy broke in a way I said to watch for: jobs went negative and the 10-year pushed further into territory where standard deal math does not work.
The public market signals — REITs and credit spreads — are still green. But both compressed this month. The optimistic scenario the public markets were pricing in July got a direct hit from the July jobs report. When institutional investors who have been rotating into real estate equities see −23,000 payrolls, that spread does not hold at 5pp.
What this means for deals right now:
Acquisitions that close in Q3 and Q4 2026 will need to pencil at 4.60%+ on the 10-year. That means higher going-in cap rates, lower leverage, longer holds, or stronger operational upside — and ideally all four. Any deal that depends on a refinance in 18 months at a lower rate is carrying a speculative assumption as a core underwriting input.
The deals getting done are the ones built to survive this environment, not the ones designed for the environment that was supposed to exist by now.
Three things to watch for September:
The August jobs report on September 4. A second consecutive negative print ends the "one-off seasonal" explanation and forces a Fed response conversation. That is the single most important data point between now and year-end.
Whether the 10-year breaks above 4.80% or pulls back toward 4.50%. The range it settles in over September sets the floor for Q4 deal volume.
Whether VNQ's lead over SPY holds above 1pp. If it inverts, the institutional rotation thesis reverses — and the most forward-looking signal on the board turns red.
The gap between public market pricing and transaction market reality has never been wider in this cycle. That gap does not close by the public markets being wrong. It closes when the transaction market catches up — or the public market corrects. September will tell us which.
Copyright 2026, Midwest CRE Advisors